





How to Interpret Your Energy Usage Patterns and Save Energy

Energy bills show what you paid, but your usage patterns explain why. By studying smart meter data, electricity meter readings, and household routines together, you can distinguish necessary energy consumption from avoidable waste.
The aim is not to chase a perfect graph. Every home has different occupants, appliances, heating systems, and schedules. A useful analysis compares similar periods, links spikes to real activities, and tests one practical change at a time.
Why Understanding Energy Usage Patterns Matters
Understanding energy usage patterns reveals when, where, and why your home consumes electricity. This makes it easier to find waste, manage expensive periods, and choose realistic efficiency improvements.
A monthly total can hide important details. Two households might use the same amount of energy in a month, while one consumes steadily and the other experiences short, expensive bursts during peak demand. Those patterns call for different actions.
Usage analysis can help you identify:
- High-consumption hours linked to heating, cooking, laundry, or hot water.
- Continuous background demand caused by routers, entertainment equipment, chargers, and other standby power.
- Changes caused by weather, occupancy, holidays, or working from home.
- Whether flexible activities could move into off-peak hours.
- Sudden increases that may reflect a faulty appliance, billing issue, or changed routine.
The financial benefit depends on your tariff and behaviour. Reducing electricity use usually lowers consumption-related charges, while shifting the same activity only helps when your supplier offers a suitable time-of-use tariff. Moving laundry to a cheaper period cannot reduce costs if every hour is priced the same.
What Your Smart Meter Data Can Tell You
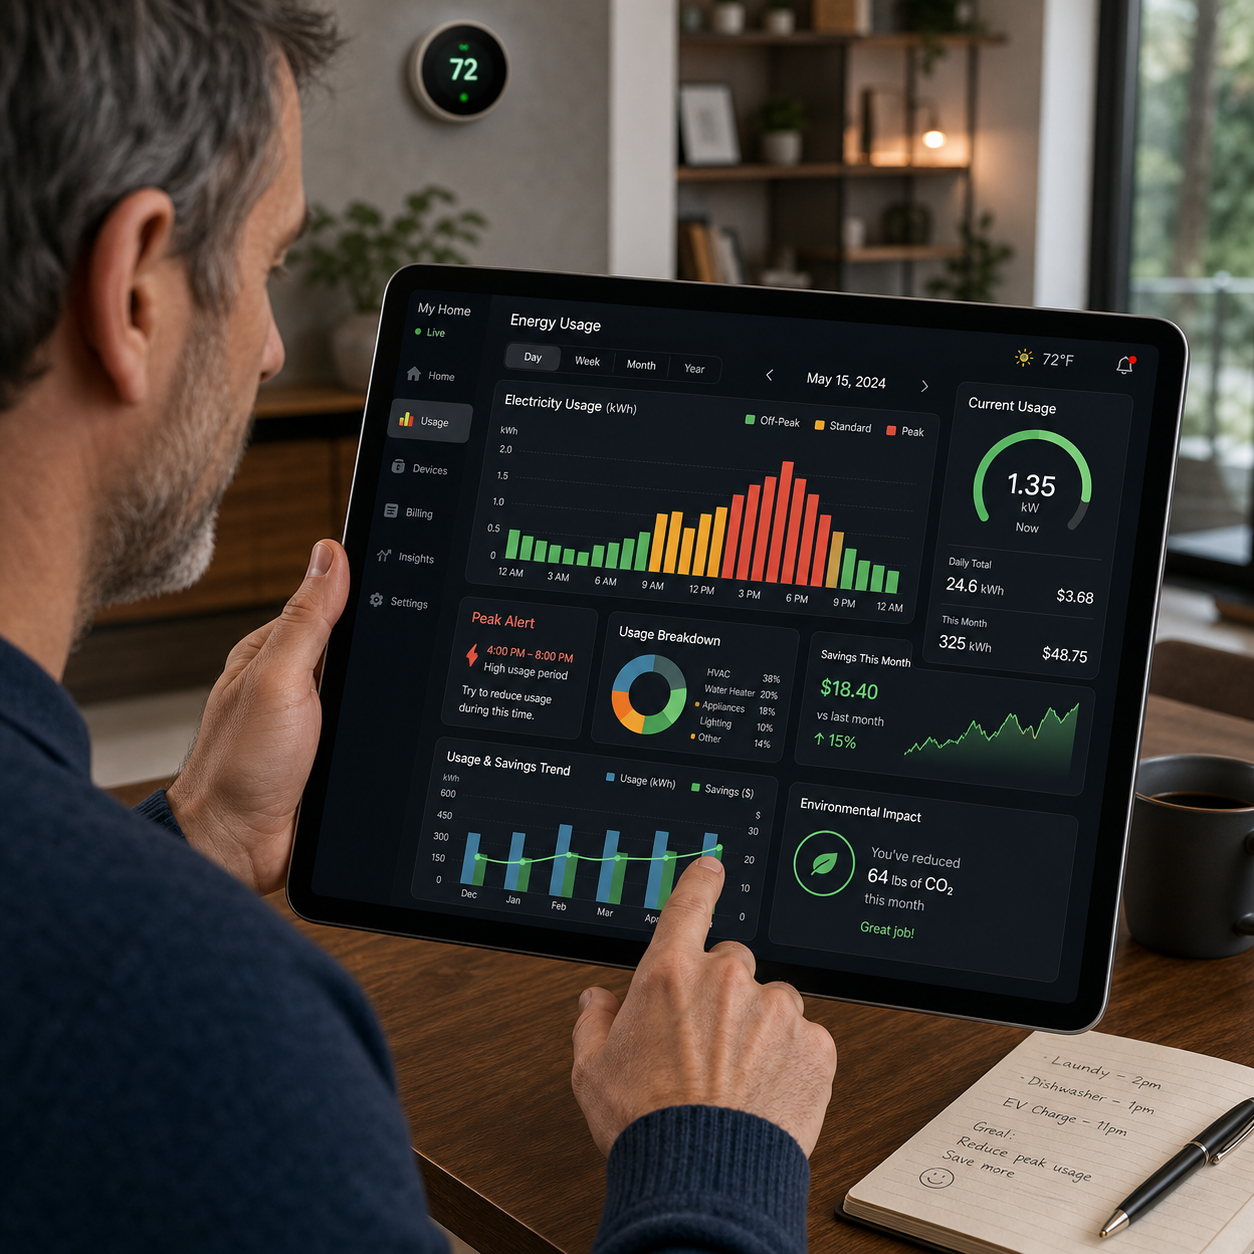
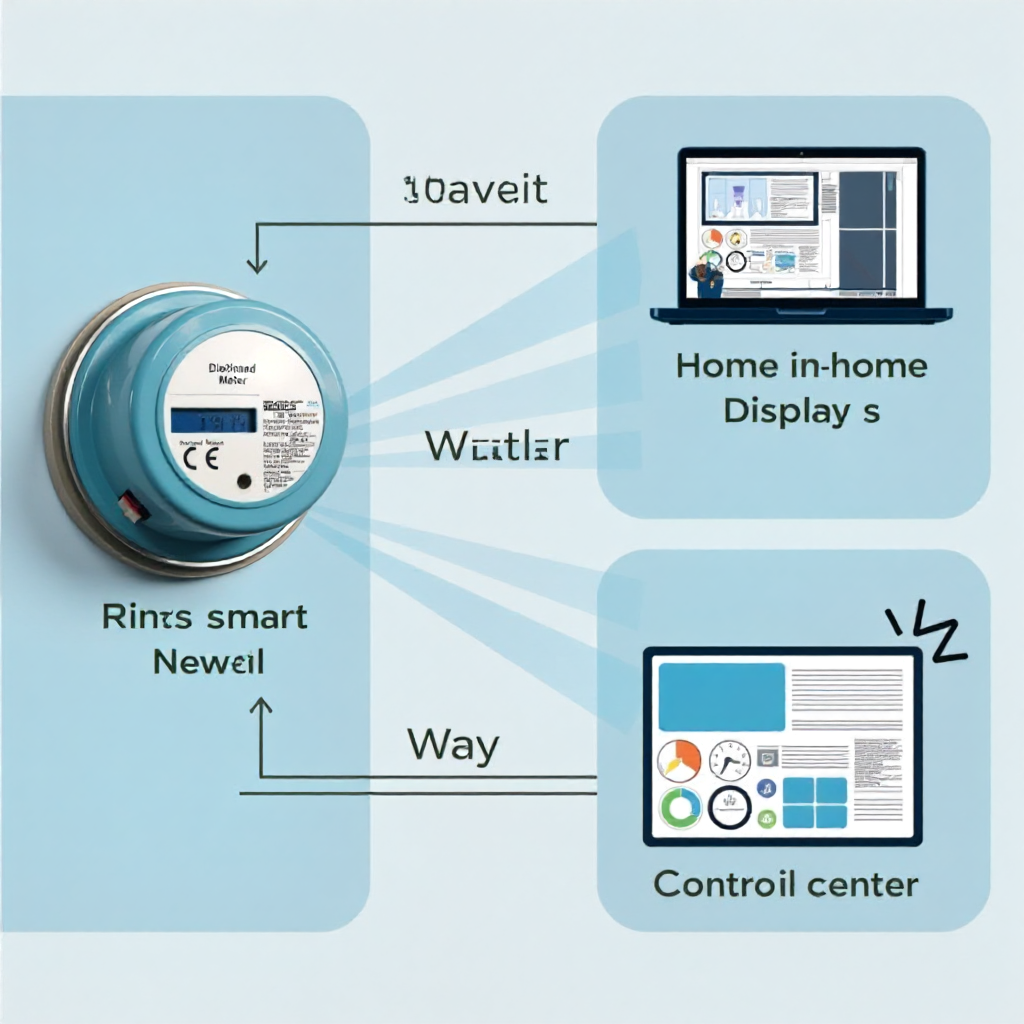
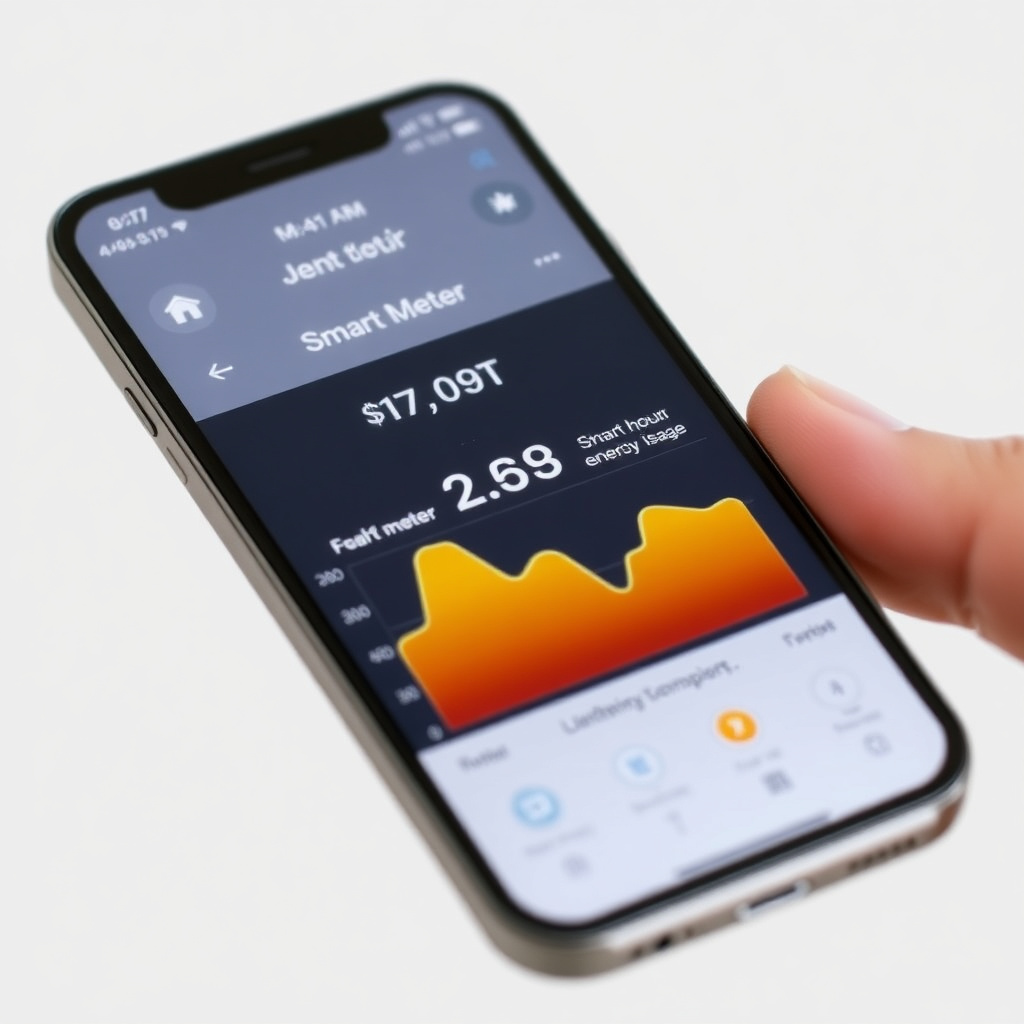
Smart meter data shows how much energy you use across defined time periods, often by hour, day, week, or month. An energy monitoring app may turn those readings into charts, comparisons, cost estimates, and alerts.
Start by confirming what the dashboard measures. Some displays show electricity consumption in kilowatt-hours, while others show estimated cost. Cost figures can change because of standing charges, taxes, tariff rates, or estimates, so use energy consumption for behaviour comparisons and your bill for final charges.
Useful views include:
- Hourly data: highlights peak-use periods and short-lived demand spikes.
- Daily data: helps connect consumption with routines such as breakfast, evening cooking, or heating.
- Weekly data: reveals differences between workdays and weekends.
- Monthly data: shows broader changes linked to seasons, occupancy, and billing periods.
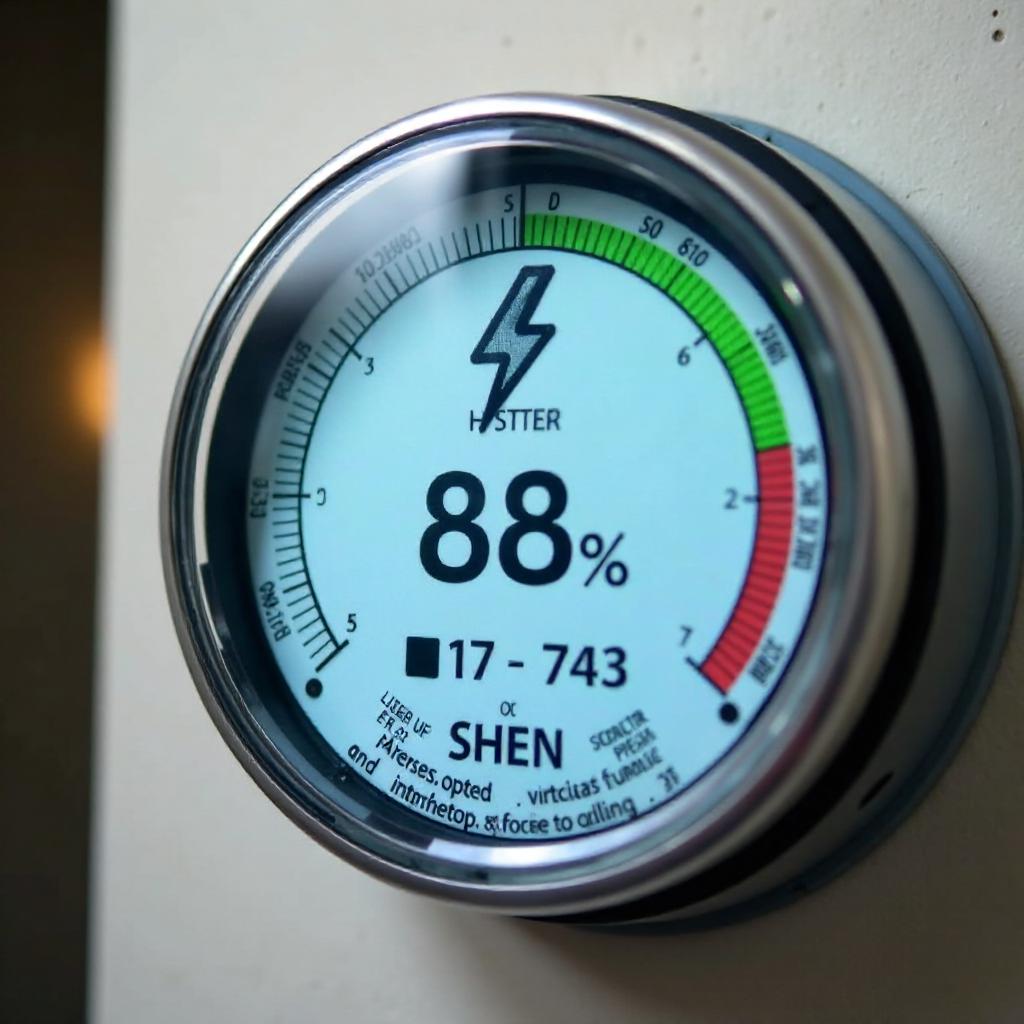
Check that the app’s date range matches your electricity bill. Billing periods rarely begin and end on the same dates as calendar months. Also compare app readings with the physical smart meter when something looks inconsistent. A delayed data feed, estimated reading, or incomplete interval record can make a normal pattern appear unusual.
For independent background on household energy use and efficiency, the U.S. Department of Energy’s Energy Saver guidance provides practical consumer information. Tariff rules and meter-data access vary by country and supplier, so local billing documentation still takes priority.
How to Identify Daily and Weekly Usage Trends
To identify daily and weekly usage trends, compare at least several similar days and match peaks with household activities. Look for repeated shapes in the data rather than judging one isolated high reading.
Use this five-step review:
- Choose comparable periods. Compare weekdays with weekdays and weekends with weekends. Avoid comparing a cold Monday with a warm Saturday.
- Mark the main peaks. Note the first sustained rise, the highest point, and the time demand returns to its normal level.
- Write down activities. Record heating, showers, cooking, laundry, gaming, electric vehicle charging, or other likely causes.
- Separate routine from exception. A repeated evening rise is a routine pattern; a single midnight spike needs investigation.
- Test one change. Move one flexible activity or alter one control setting, then compare the next equivalent period.
Many homes show a morning increase as people heat rooms, make breakfast, use hot water, and prepare for work or school. An evening peak may combine lighting, cooking, entertainment, laundry, and space heating. These patterns are not automatically wasteful. The useful question is whether the energy is serving a necessary activity and whether its timing or intensity can change.
Weekly comparisons often expose occupancy effects. Working from home, hosting visitors, or spending a weekend indoors can raise consumption without indicating a fault. Add a short note beside each day in your records. Context turns a graph into evidence.
Finding Energy-Intensive Appliances and Activities
To find energy-intensive appliances, match smart meter spikes with appliance cycles and test suspected devices individually. Heating, hot water, cooking, laundry, and electric resistance appliances often have a larger effect than small chargers.
Begin with equipment that runs for long periods or draws substantial power. Depending on the property, this may include:
- Electric space heaters, storage heaters, heat pumps, or immersion heaters.
- Water heaters, tumble dryers, washing machines, and dishwashers.
- Ovens, hobs, kettles, and other cooking appliances.
- Refrigerators and freezers, especially if seals are damaged or temperatures are poorly set.
- Electric vehicle chargers and workshop equipment.
- Always-on devices that contribute to standby power over many hours.
Power and energy are related but different. A kettle may draw high power briefly, while a router draws little power continuously. The smart meter records the accumulated energy consumption, so duration matters. A simple experiment is to record the household baseline, run one appliance while other activity stays as consistent as possible, and compare the interval data afterward.
Plug-in energy monitors can help with individual appliances, but use them only according to the manufacturer’s instructions. Never open a meter, alter wiring, bypass safety controls, or connect unsuitable equipment. For built-in circuits or suspected electrical faults, use a qualified electrician.

Recognising Seasonal Changes and Unusual Usage
Seasonal changes usually reflect heating, cooling, lighting, hot water, and altered occupancy, while unusual usage appears as a new or unexplained deviation. Compare the current pattern with similar weather and household conditions before assuming something is wrong.
Winter energy consumption may rise because rooms need more heating and daylight hours are shorter. Summer demand can increase when fans, air conditioning, pool pumps, or refrigeration run more often. A seasonal baseline should therefore include weather context, not just the calendar month.
Occupancy also matters. A holiday may reduce weekday demand, but guests can increase hot-water and cooking loads. Remote work can add daytime heating, lighting, computing, and meal preparation. These are genuine changes in energy demand, not necessarily waste.
Investigate a sudden increase using this sequence:
- Check whether the smart meter or energy monitoring app has complete, estimated, or delayed data.
- Compare the meter reading with the bill and verify the billing dates.
- Review changes in weather, occupancy, heating schedules, and appliance use.
- Look for equipment that runs continuously, cycles more often, or fails to switch off.
- Contact your supplier if readings remain inconsistent or appear impossible.
A sharp rise accompanied by a new humming appliance, persistent heating, or unexplained hot water use deserves prompt attention. Do not diagnose internal wiring yourself. Record the dates and observations so a supplier, landlord, or electrician can investigate efficiently.
Turning Usage Insights into Energy-Saving Actions
To turn usage insights into savings, prioritise the largest repeatable pattern, change one controllable factor, and measure the result. This approach prevents guesswork and helps you focus on actions that fit your home.
Use a practical priority filter
Rank each opportunity using three questions: How large is the energy impact? How often does it occur? How easy is it to change? A daily heating pattern may deserve attention before an occasional high-power appliance, even when both appear prominent on a chart.
- Shift flexible demand: Run laundry, dishwashers, water heating, or vehicle charging during off-peak hours when your time-of-use tariff makes that worthwhile.
- Reduce standby power: Switch off equipment that does not need to remain active, using safe power strips where appropriate. Avoid disconnecting devices that provide essential safety, security, heating, or medical functions.
- Improve heating control: Review schedules, room temperatures, zoning, and draughts. Small control changes may help, but comfort, ventilation, and condensation risks still matter.
- Control hot water: Check timers and temperatures according to manufacturer or professional guidance. Do not make unsafe changes to boilers or electrical systems.
- Reduce unnecessary cycles: Wash full loads, use suitable eco settings, and avoid running appliances simply because they are available.
Choosing off-peak operation for lower-cost timing means accepting a scheduling constraint. Likewise, reducing heating can lower consumption but may be unsuitable for vulnerable occupants or poorly insulated rooms. The right action is the one that reduces avoidable demand without creating a safety, health, or comfort problem.
How to Track Progress Over Time
To track progress, establish a baseline, repeat measurements under comparable conditions, and assess both energy consumption and cost. A single lower bill does not prove that one action worked.
Record two to four weeks of normal usage if possible. Note daily or weekly kilowatt-hours, weather, occupancy, major appliance changes, and tariff periods. Then introduce one intervention, such as changing a laundry schedule or adjusting a heating timetable, and monitor an equivalent period.
Use a simple review table:
- Baseline period: dates, total consumption, weather, and normal routines.
- Action period: the specific change and when it was applied.
- Comparison: consumption per day, peak-use timing, and relevant bill cost.
- Decision: keep, modify, or stop the action based on results and comfort.
Look for repeated improvement across at least two comparable periods. If consumption falls but cost does not, a tariff or billing-rate change may explain the difference. If cost falls while consumption stays similar, timing may have improved under a time-of-use tariff. Keep meter readings, app data, and bills together; each provides a different part of the explanation.
Frequently Asked Questions About Energy Usage Patterns
What does a normal energy usage pattern look like?
There is no universal normal pattern. A household’s energy consumption depends on home size, insulation, heating system, appliances, climate, occupants, and daily routines. Compare your data with your own previous periods under similar conditions.
How can I find which appliances use the most energy?
Match smart meter spikes with appliance operation, then use a compatible plug-in energy monitor for individual devices. Focus on equipment that operates for long periods or combines high power with frequent use.
Why does my energy usage increase at certain times of day?
Increases commonly follow household routines such as heating, hot water, cooking, laundry, lighting, and entertainment. Check whether the timing is repeated and whether your tariff applies higher rates during those peak-use periods.
Can a smart meter help reduce my energy bills?
A smart meter can support lower bills by making energy consumption and peak demand easier to see. It does not reduce usage automatically; savings depend on the actions you take and the rates in your tariff.
What should I do if my energy usage suddenly rises?
Check the meter, app data, billing dates, weather, occupancy, and newly used appliances first. If the increase remains unexplained, contact your energy supplier or a qualified professional rather than attempting electrical work yourself.