

Understanding Your Smart Meter Data: A Beginner's Guide

Your smart meter is quietly collecting data around the clock — but most people never look at it beyond the occasional glance at their In-Home Display. That's a missed opportunity. Once you understand what your smart meter data actually shows, it becomes one of the most practical tools you have for managing your energy use and keeping bills under control.

What Is a Smart Meter and What Data Does It Collect?

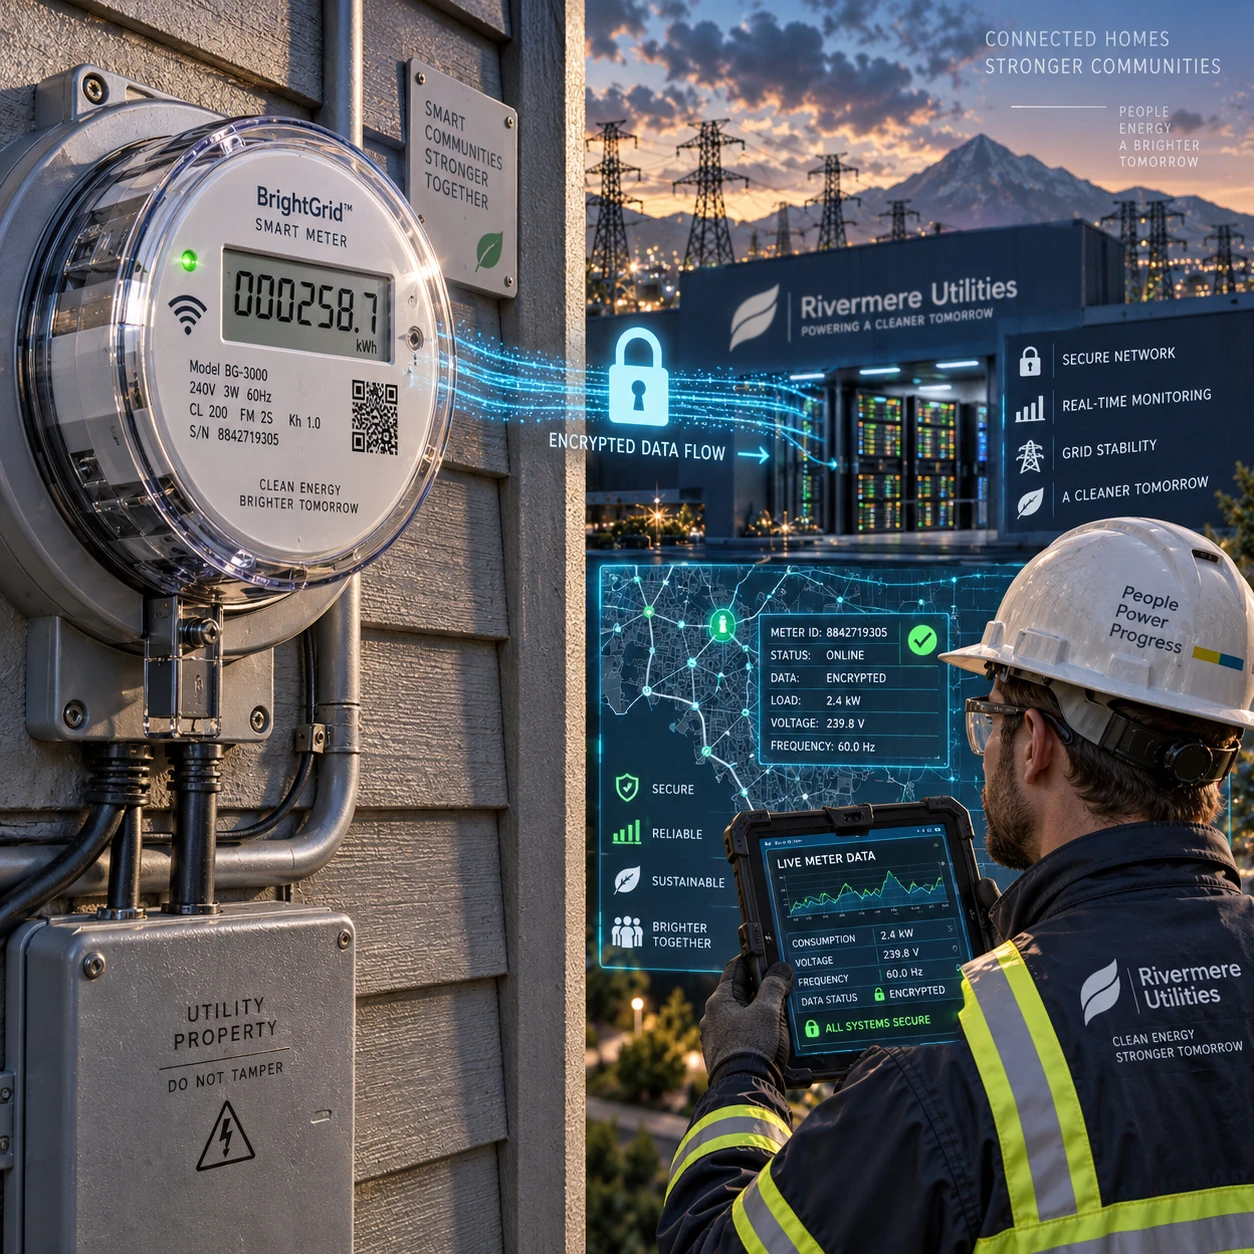
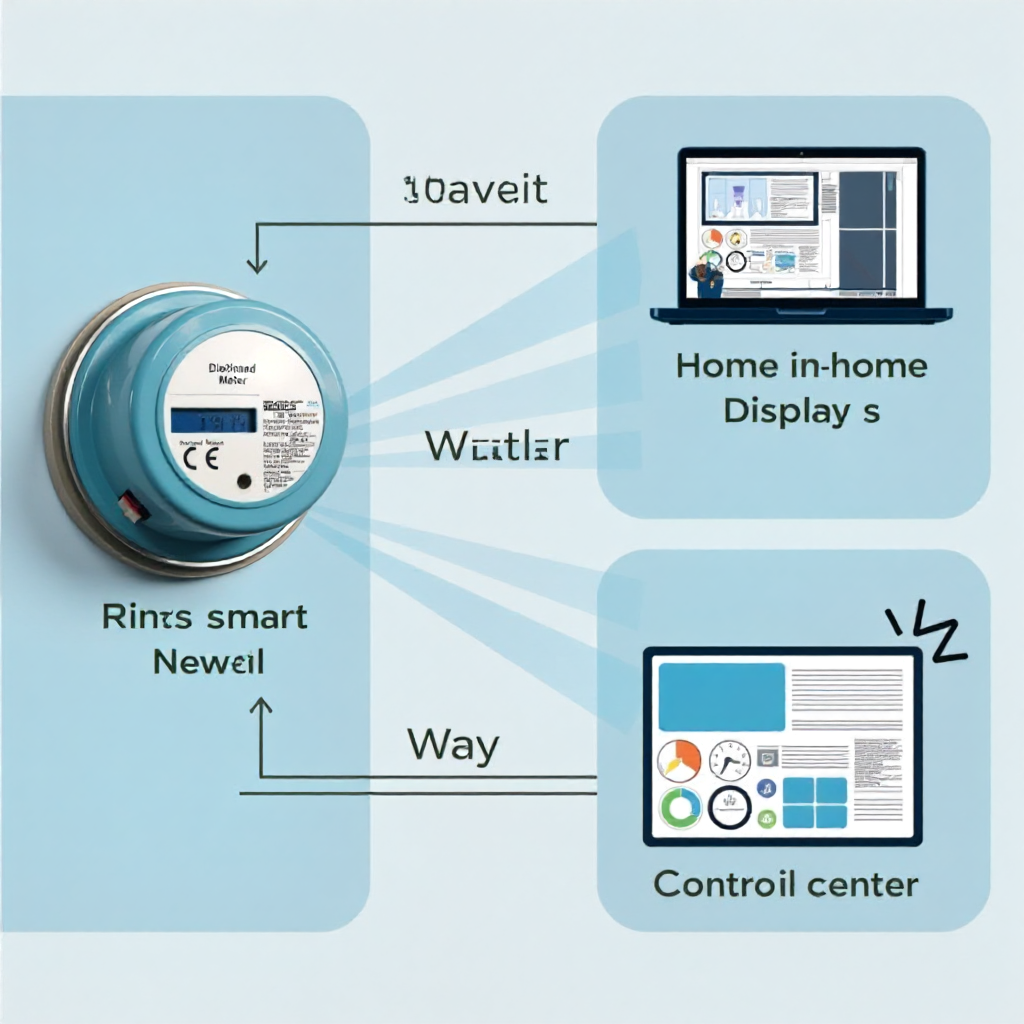
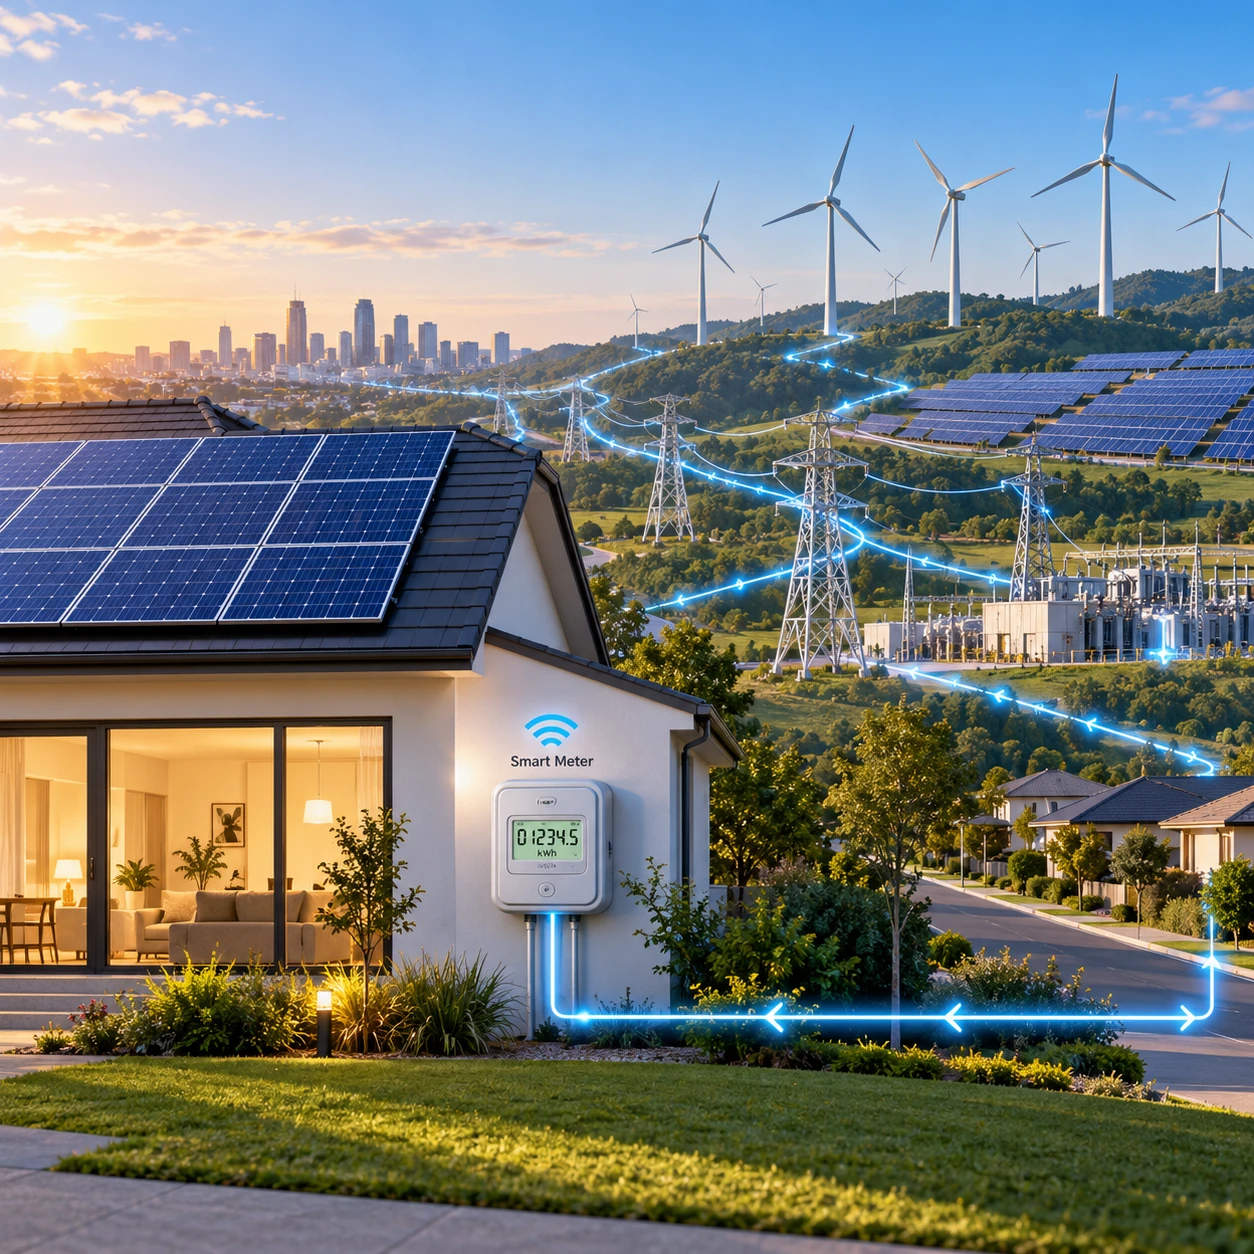
A smart meter is a digital energy meter that automatically records your electricity and gas consumption and sends that information directly to your energy supplier — no manual readings required. Unlike a traditional meter, which simply shows a running total you have to read yourself, a smart meter logs usage in detail and transmits it wirelessly.

Most homes in the UK now have either a SMETS1 (first-generation) or SMETS2 (second-generation) smart meter. SMETS2 meters connect through the national Data Communication Company (DCC) network, which means they work across all suppliers. SMETS1 meters were tied to specific suppliers, which caused problems when people switched — more on that later.

The data your smart meter collects includes:

  • How much electricity or gas you use, measured in kWh (kilowatt-hours)
  • When you use it — broken into half-hourly intervals throughout the day
  • Your cumulative consumption over days, weeks, and months

Both your electricity meter and gas meter (if you have one) collect this information independently. The gas meter typically sends data less frequently than the electricity meter, but the principle is the same.

How to Access Your Smart Meter Data

You can access your smart meter data in three main ways: through your In-Home Display, your supplier's app or online portal, or by downloading a data export.

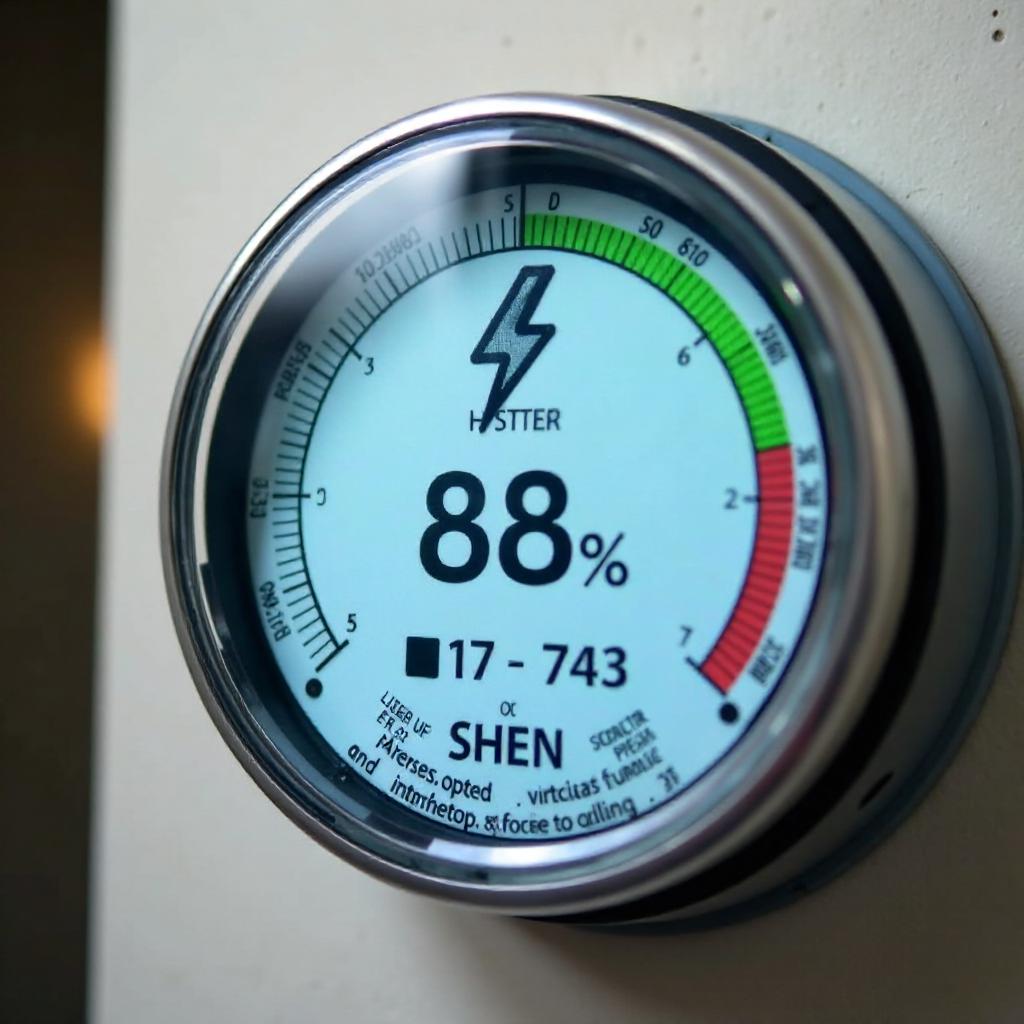
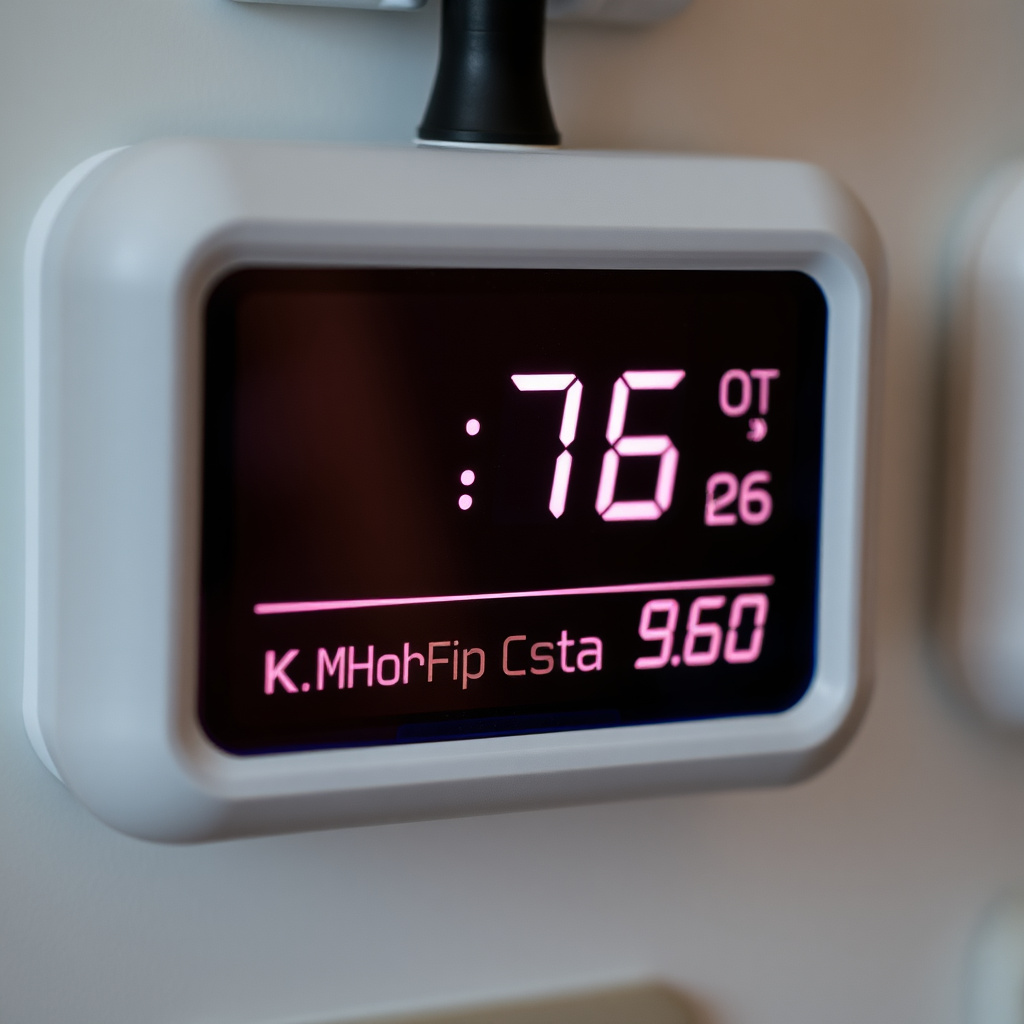
The In-Home Display (IHD) is the small screen device that came with your smart meter installation. It's the most immediate access point — it shows your current energy use in near real time, along with daily and weekly totals. For most people, this is the easiest starting point. Keep it somewhere visible, like the kitchen, and you'll naturally start noticing patterns.

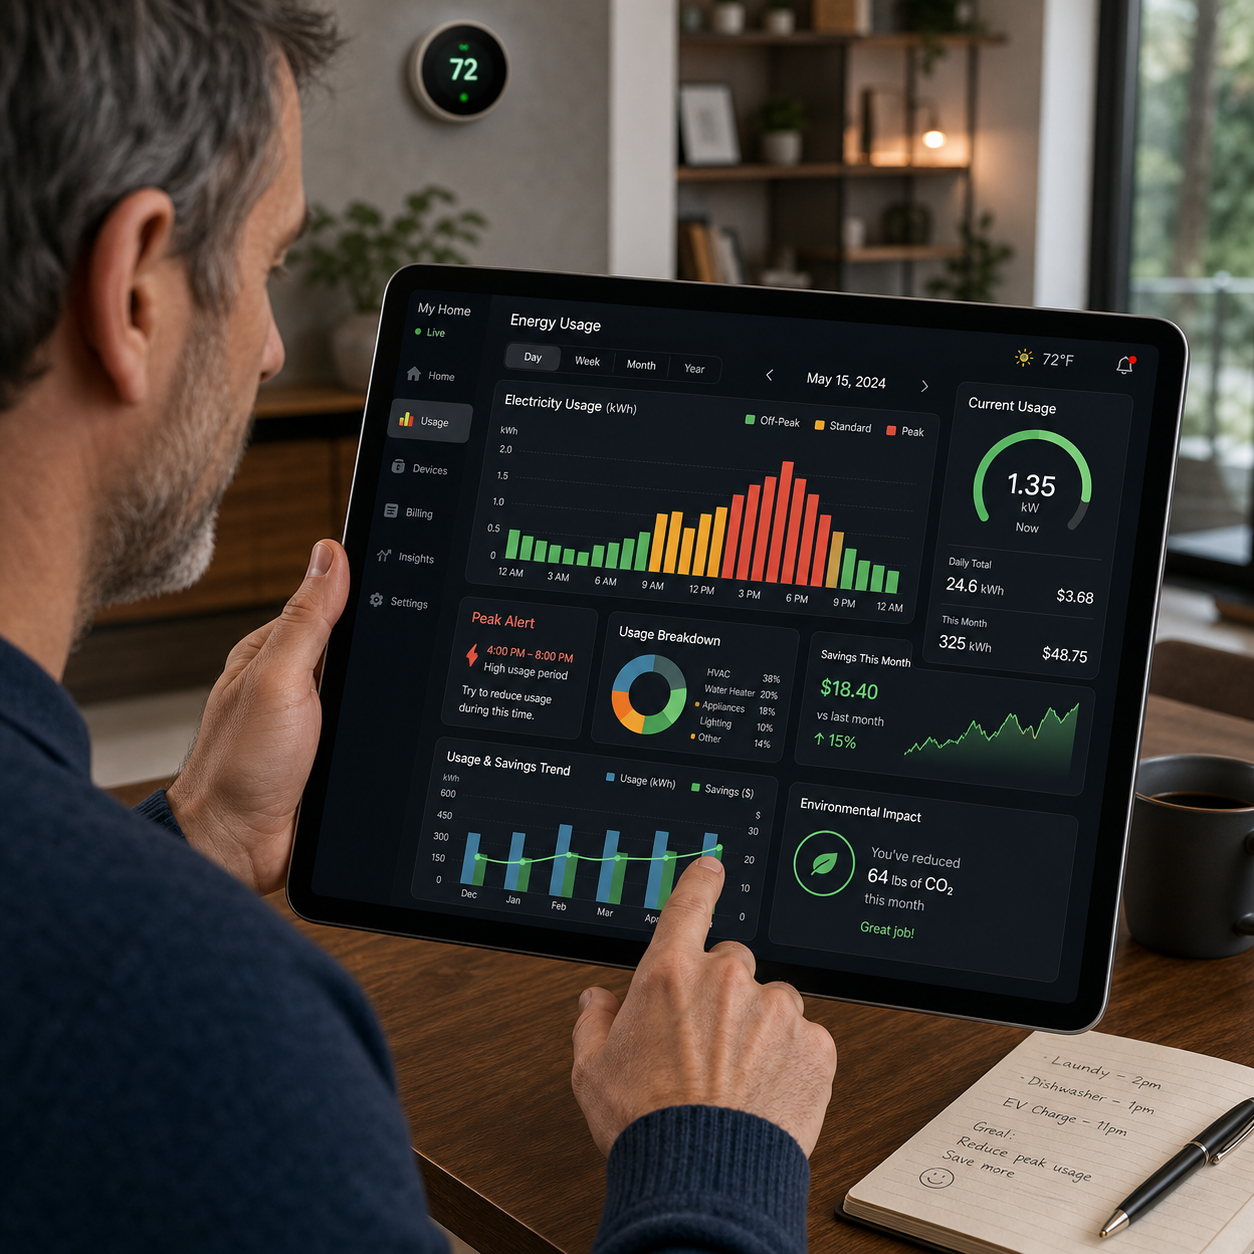
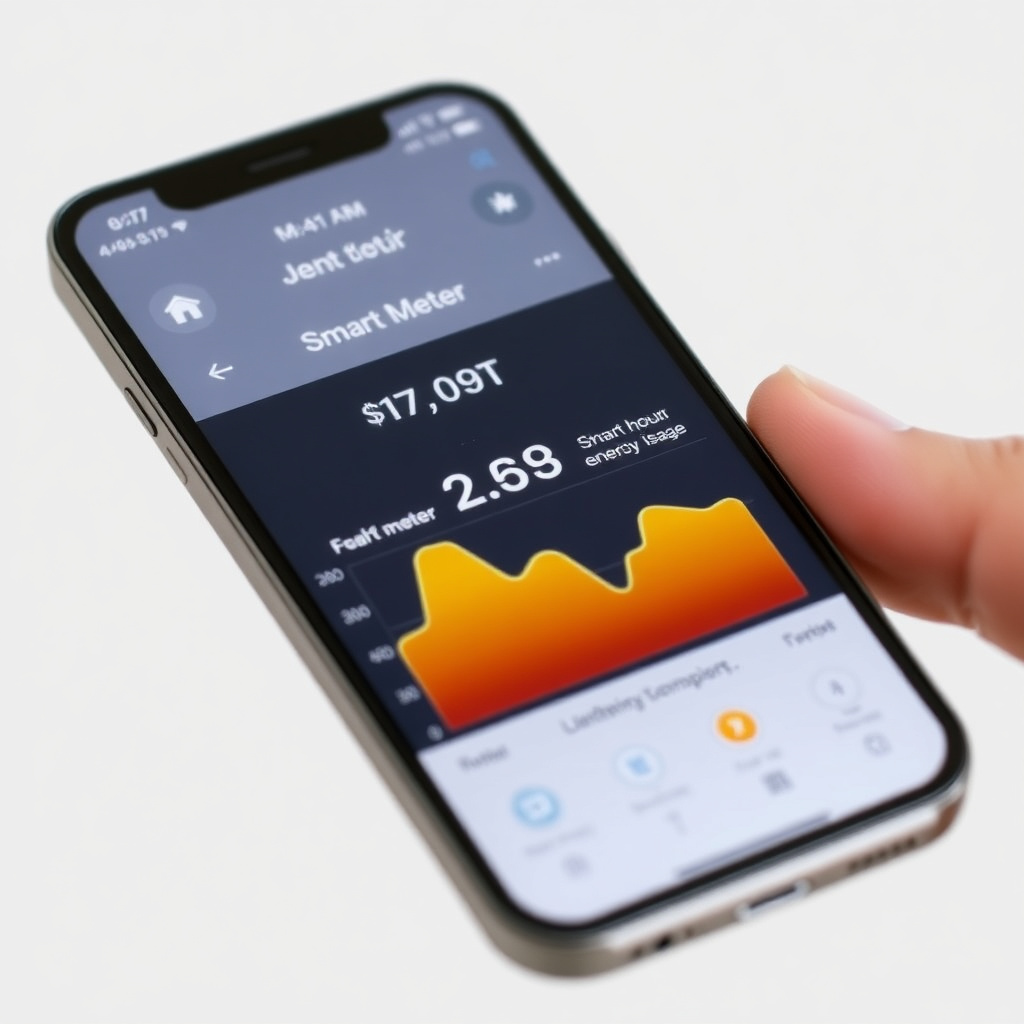
Your energy supplier portal or mobile app gives you a more detailed historical view. Log in to your account and look for a section labelled something like "energy usage," "my data," or "consumption history." Here you can typically see breakdowns by day, week, or month, and in many cases drill down into half-hourly intervals.

Some suppliers also let you download your consumption data as a CSV file. This is useful if you want to analyse your usage in a spreadsheet or share it with a third-party energy comparison service. The option is usually found in your account settings under data or privacy preferences.

Reading Your Data: What the Numbers Actually Mean

The core unit you'll see everywhere is the kilowatt-hour (kWh) — this is the standard measure of energy consumption. One kWh is the amount of energy used by a 1,000-watt appliance running for one hour. A kettle uses roughly 0.1 kWh per boil; a tumble dryer might use 2.5 kWh per cycle.

When you look at your data, you'll typically see three types of breakdown:

  • Half-hourly data: your usage split into 48 slots across each day. This is the most granular view and shows exactly when your consumption spikes.
  • Daily totals: useful for spotting which days you use more energy — weekends versus weekdays, for example.
  • Monthly summaries: helpful for tracking seasonal trends and comparing against previous years.

A typical UK household uses around 2,700–3,100 kWh of electricity per year, though this varies significantly by home size and habits. If your daily total looks unusually high, the half-hourly view will usually point you toward the cause — a long shower, an oven left on, or overnight heating that ran longer than expected.

How Smart Meter Data Can Help You Save Money

Smart meter data helps you save money by showing you exactly when and where you're using the most energy — so you can change the habits that cost the most. Vague awareness that "the heating is expensive" is much less actionable than seeing a clear spike every morning between 7am and 9am.

Here's a practical approach: look at your half-hourly data for a typical weekday and a weekend day. Identify the three largest spikes. For each one, ask yourself whether that usage was necessary, or whether it could be shifted to a cheaper time of day.

This matters more if you're on — or considering — a time-of-use energy tariff. These tariffs charge different rates depending on when you use electricity, with cheaper rates during off-peak hours (often overnight). Smart meter data is what makes these tariffs possible, because your supplier can see exactly when you consumed each unit. If you shift dishwasher or washing machine cycles to off-peak windows, the savings can be meaningful over a year.

Even on a standard tariff, identifying energy-hungry habits — like leaving devices on standby, or running a second fridge that's barely used — can trim your bill without any real sacrifice.

Smart Meter Data and Your Privacy: What You Should Know

Your smart meter data is shared with your energy supplier by default, but you have control over how detailed that sharing is. The key choice is around reading frequency: you can typically opt for monthly, daily, or half-hourly data sharing with your supplier.

Monthly readings are enough for accurate billing. Half-hourly sharing gives your supplier — and you — a much richer picture of your consumption patterns. Some people are comfortable with that; others prefer to limit it. Neither choice is wrong.

Your supplier is required to handle your consumption data in line with UK data protection law. Ofgem publishes guidance on what suppliers can and cannot do with your data, including rules around sharing it with third parties for marketing purposes without your consent.

The Data Communication Company (DCC) manages the secure network that carries data between smart meters and suppliers. It operates under a regulated framework, so the infrastructure itself isn't something you need to worry about. The practical question is simply: how much detail do you want your supplier to see, and how often?

Common Problems: When Your Data Looks Wrong or Goes Missing

Gaps in smart meter data are more common than they should be, and the cause is usually one of a few things. The most frequent issue is a lost connection between your meter and your In-Home Display — the IHD relies on a short-range wireless signal, and thick walls, distance, or interference can break it. Try moving the IHD closer to the meter, or restarting it by holding the power button.

If your supplier's portal shows missing data for several days, it may be a communication issue between your meter and the network. This is more common with SMETS1 meters, which were designed to work with specific suppliers. If you switched supplier and your smart meter stopped sending data, that's likely why — your SMETS1 meter effectively reverted to a "dumb" meter from the new supplier's perspective.

SMETS2 meters don't have this problem because they connect through the DCC network, which all suppliers can access. If you have a SMETS1 meter, ask your current supplier whether it can be enrolled onto the DCC network — many can be, without a physical replacement.

If your readings look implausibly high or low, check whether your meter is reading in cubic metres or cubic feet (for gas) and that your supplier is applying the correct conversion factor. A mismatch here can make your gas consumption look wildly off.

Next Steps: Making the Most of Your Smart Meter

The best immediate action is to set up your supplier's app or online account if you haven't already, and spend ten minutes looking at last week's half-hourly data. You'll likely spot something you didn't expect.

From there, a few practical steps worth taking:

  • Check whether your current energy tariff matches your usage pattern. If you use a lot of electricity in the evenings, a time-of-use tariff might not suit you — but if you can shift loads to overnight, it could.
  • Set up usage alerts if your supplier offers them. A notification when your daily spend exceeds a threshold is a simple way to catch unusual consumption early.
  • Review your data quarterly, not just when a bill arrives. Seasonal changes in consumption are normal, but a sudden unexplained increase is worth investigating.

Smart Energy GB, the organisation behind the UK's smart meter rollout, has additional resources for consumers who want to go deeper. But honestly, the most valuable thing you can do is just start looking at your data regularly. The numbers tell a story about your home — and once you can read it, you're in a much better position to act on it.

Frequently Asked Questions

What is half-hourly smart meter data?

Half-hourly data is your energy consumption broken into 48 individual slots across each 24-hour period. Each slot shows how many kWh you used in that 30-minute window. It's the most detailed view available and is particularly useful for spotting which times of day drive your highest usage.

Why is my In-Home Display not showing data?

The most common cause is a lost wireless connection between the IHD and your smart meter. Try moving the display closer to the meter and restarting it. If the problem persists, contact your energy supplier — they can often re-pair the devices remotely.

Can my energy supplier see my smart meter data in real time?

Not by default. Most suppliers receive data at the frequency you've agreed to — monthly, daily, or half-hourly. Real-time access requires your explicit consent and is not standard practice for billing purposes.

What is the difference between SMETS1 and SMETS2?

SMETS1 meters were the first generation of smart meters and were linked to specific suppliers. SMETS2 meters connect through the national DCC network, making them compatible with all suppliers. If you switch energy supplier with a SMETS1 meter, it may lose its smart functions — though many can now be enrolled onto the DCC network without replacement.

How do I download my smart meter data?

Log in to your energy supplier's online account or app and look for a data export or download option, usually in the account settings or usage section. Data is typically available as a CSV file covering your half-hourly consumption history.

{{HOMEPAGE_LINKS}}